Facilitation feature gate test
Context:
All our facilitation features are accessible to free plan users. However, our competitors have some of their facilitation features, such as voting, gated behind paywalls, and use these as primary triggers to encourage users to upgrade.
Hypothesis:
We believe that if we move voting, private mode, timer, custom toolbar, and laser as paid features will increase conversion. We’ll know this is true when we see an increase of free-to-paid plan upgrades.
Role:
Senior Product Designer
Team:
Murali Kundasi, PM
Avi Warner, Eng Manager
Alex Moreno, Senior Data Analyst
Andy Thomas, Senior Eng
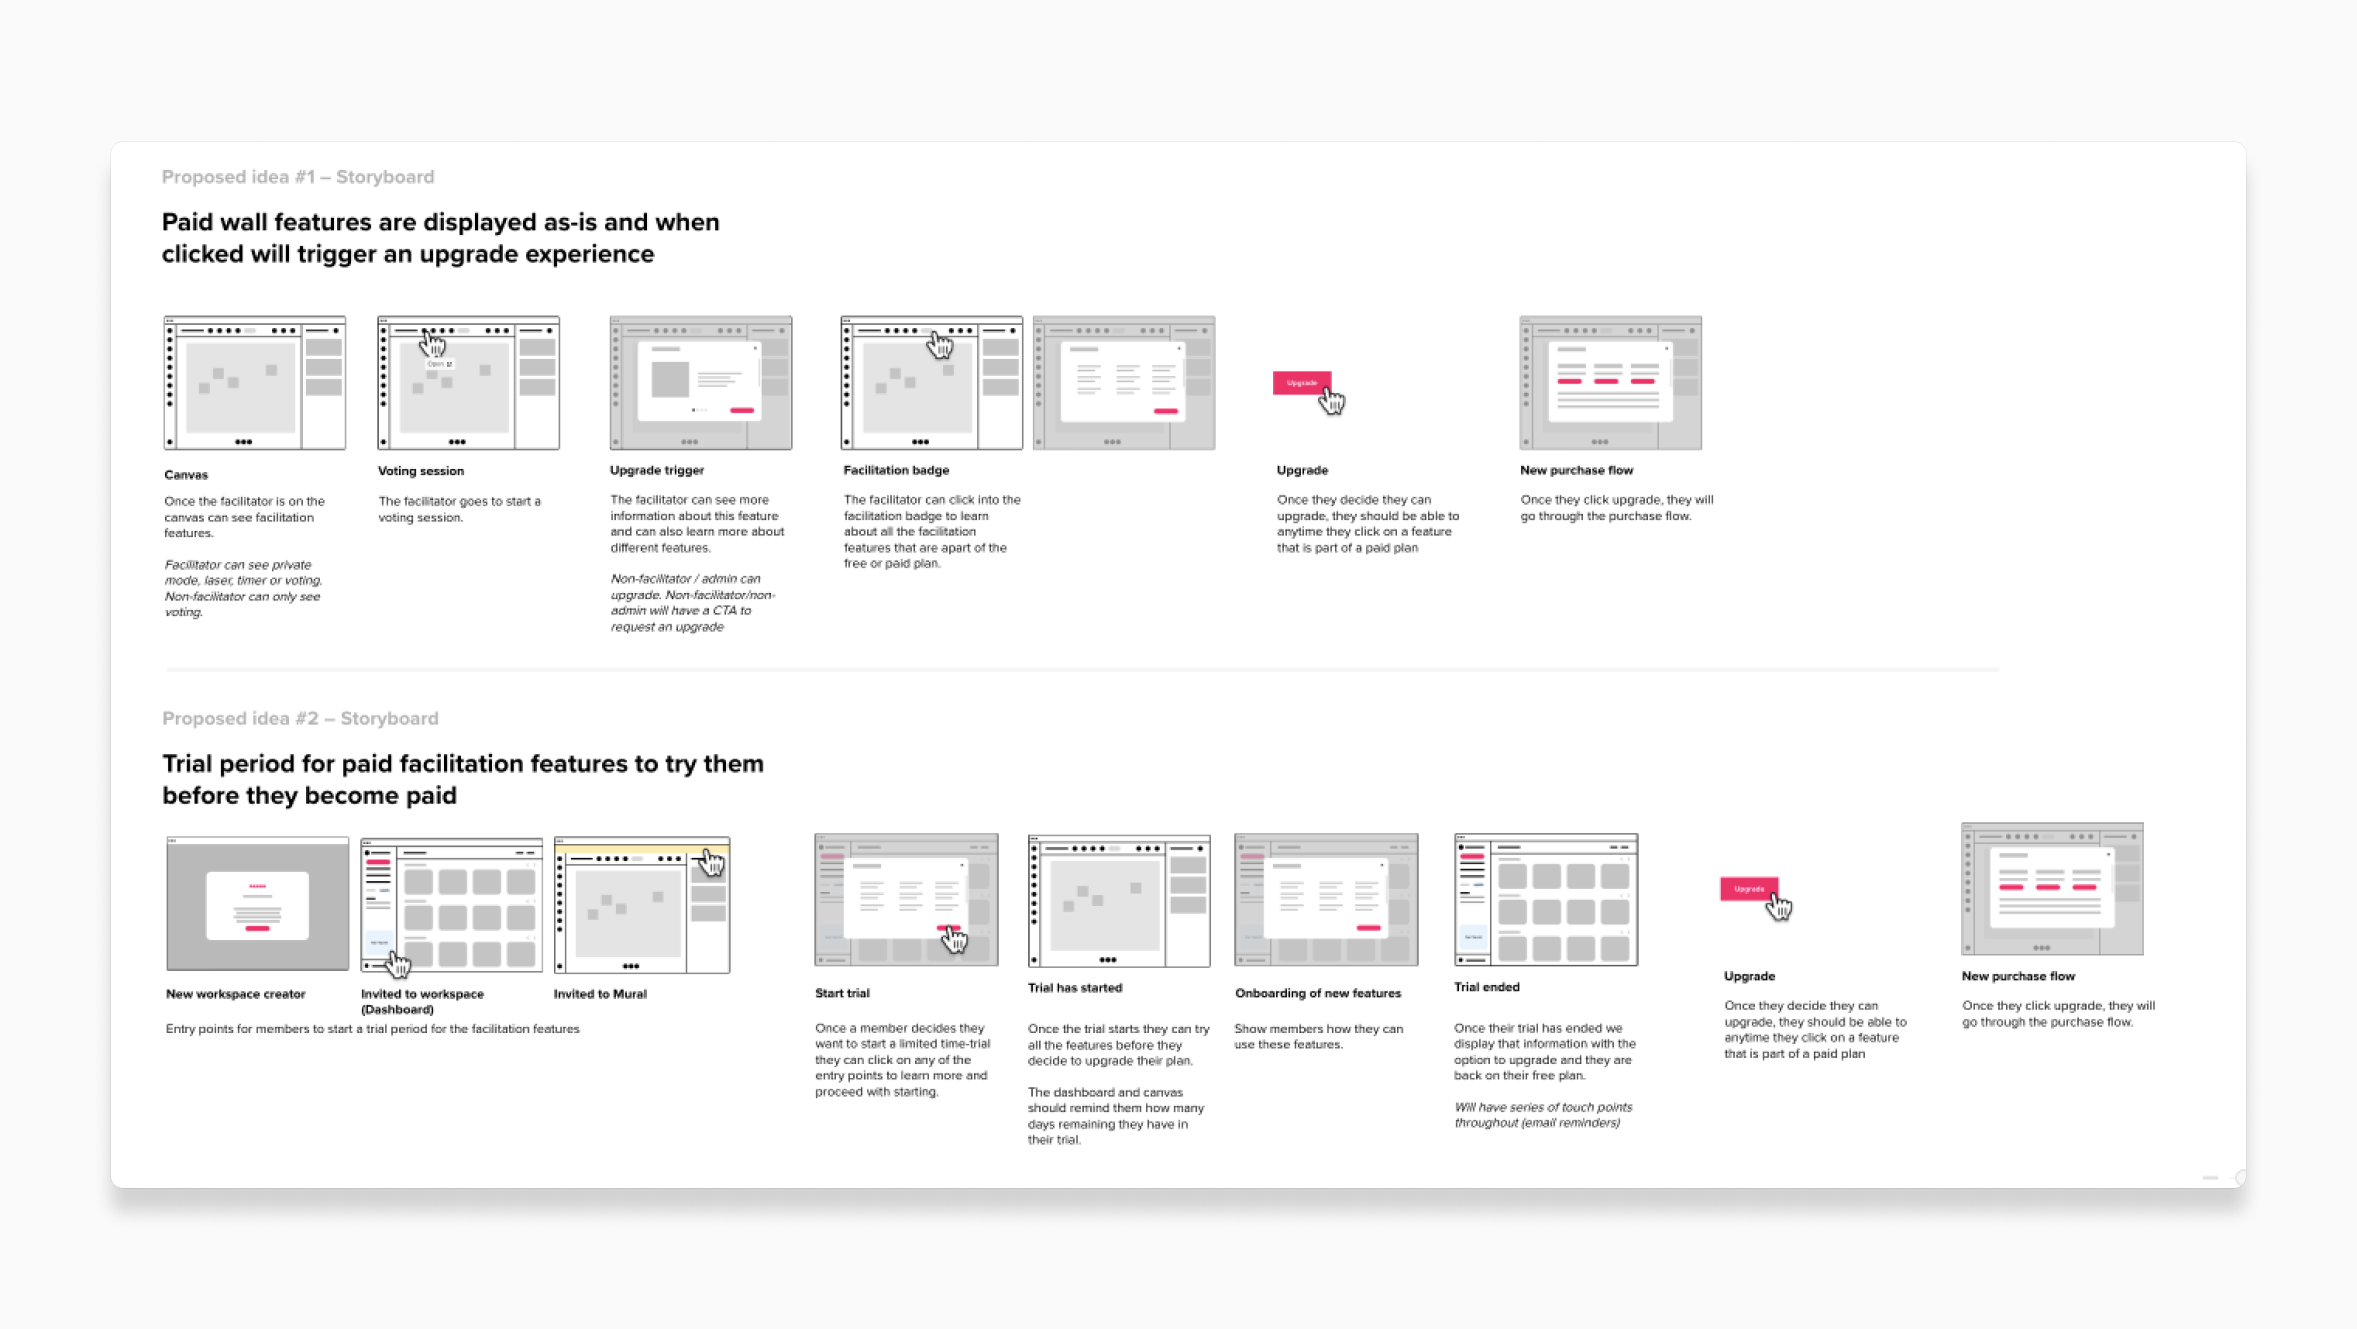
Storyboards
For this experiment, I created storyboards of different solutions that we could explore to determine if it makes sense to build it out as an A/B test or multi-variant. At this stage this is also helpful for the engineering team to determine level of effort before we pick the final solution.
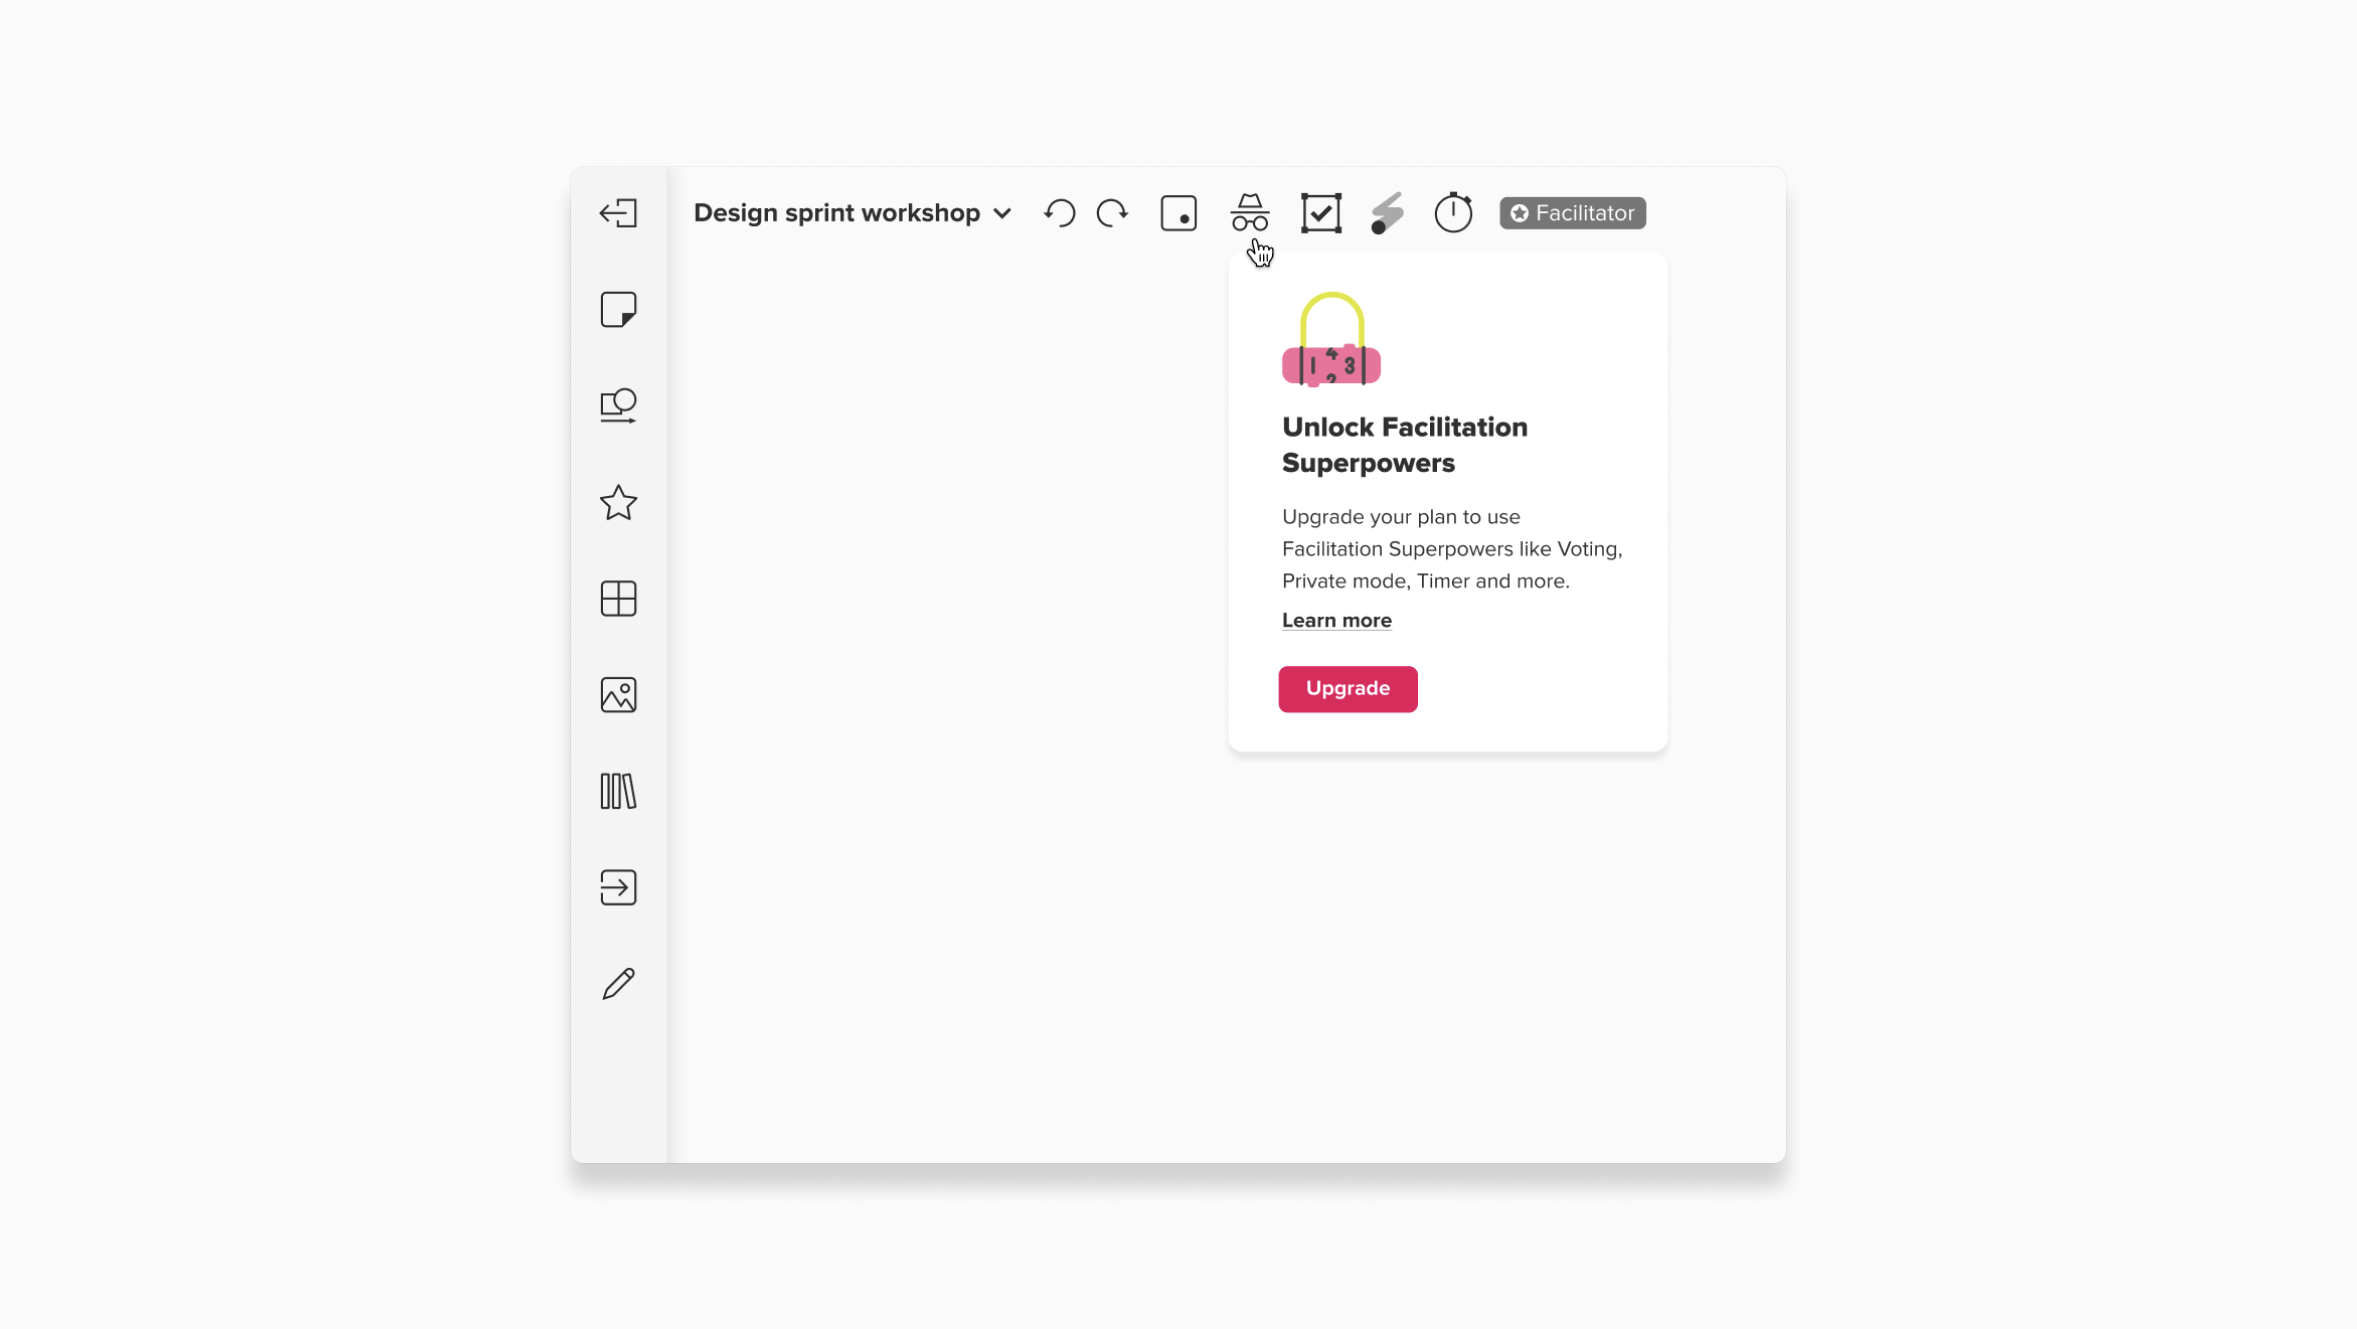
Design
For two weeks, 50% of all new free plan users will see the feature gate upgrade modal. Users will see an upgrade modal when they click on the facilitation features. The other 50% will see the current experience which doesn’t have any facilitation feature gated.
Results:
We found no statistically significant increase in the conversion rate when limiting the facilitation features. Despite the lack of change, this experiment provided valuable insights for the Pricing team as they developed a new membership model for Mural.
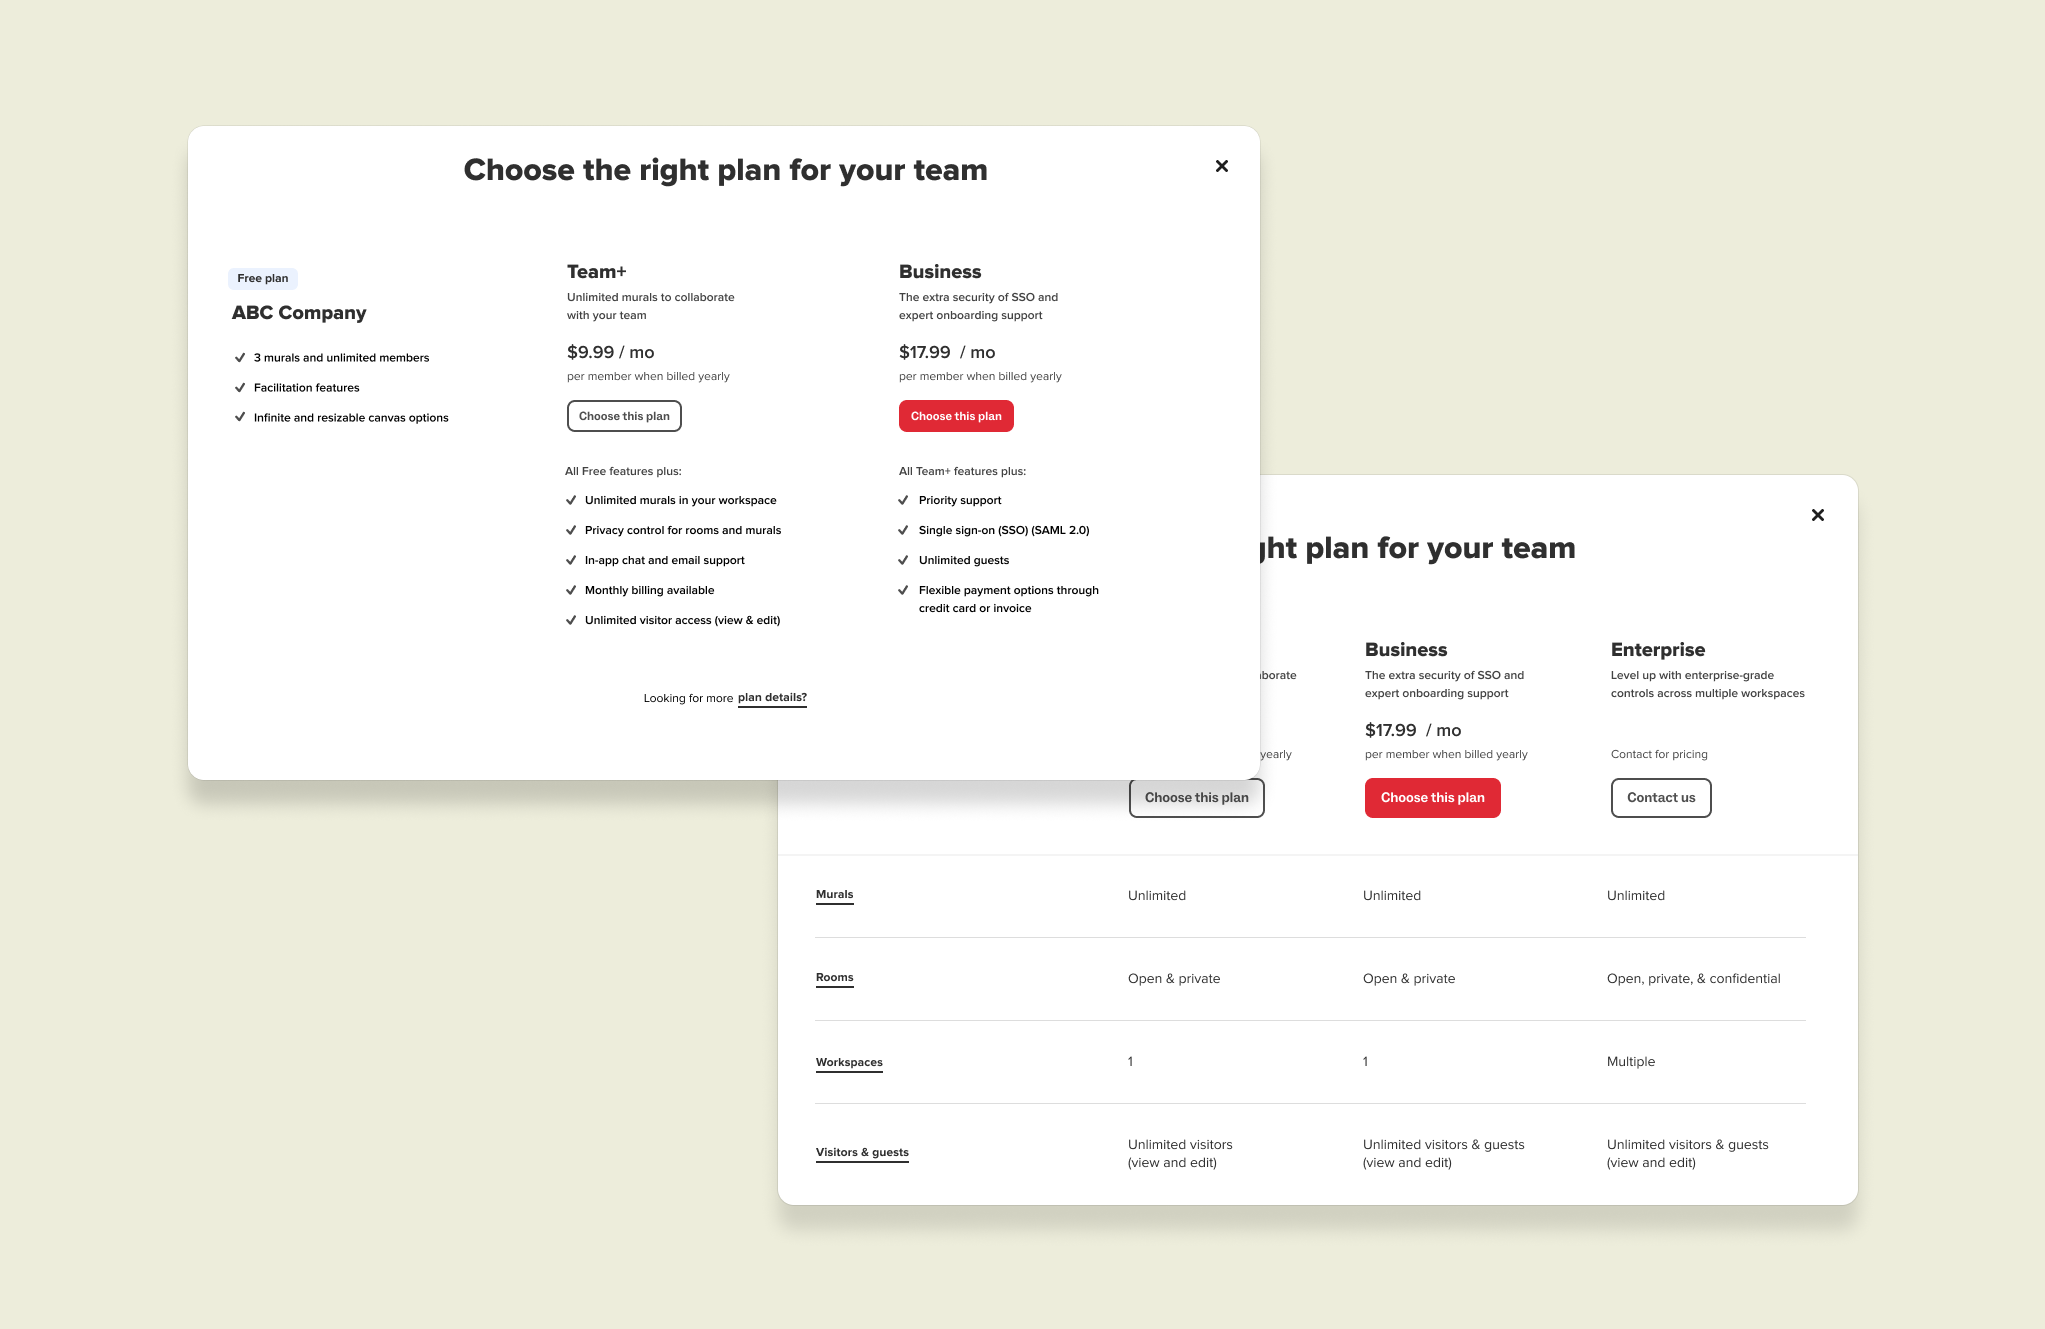
Plan comparison test
Context:
The plan comparison page displays a matrix of Mural’s online plans, with information and design consistent with the pricing page on the marketing website. During usability testing for the redesigned purchase flow, we received common feedback that the comparison list required excessive scrolling. Users expressed a desire for a quicker way to understand the key differences between each plan.
Hypothesis:
We believe that the plan comparison page can be optimized to focus on value proposition of plans for Free plan and Team+ plan users. We’ll know this is true when we see an increase of membership upgrades.
Role:
Senior Product Designer
Team:
Murali Kundasi, PM
Avi Warner, Eng Manager
Alex Moreno, Senior Data Analyst
Brenden Riley, Senior Eng
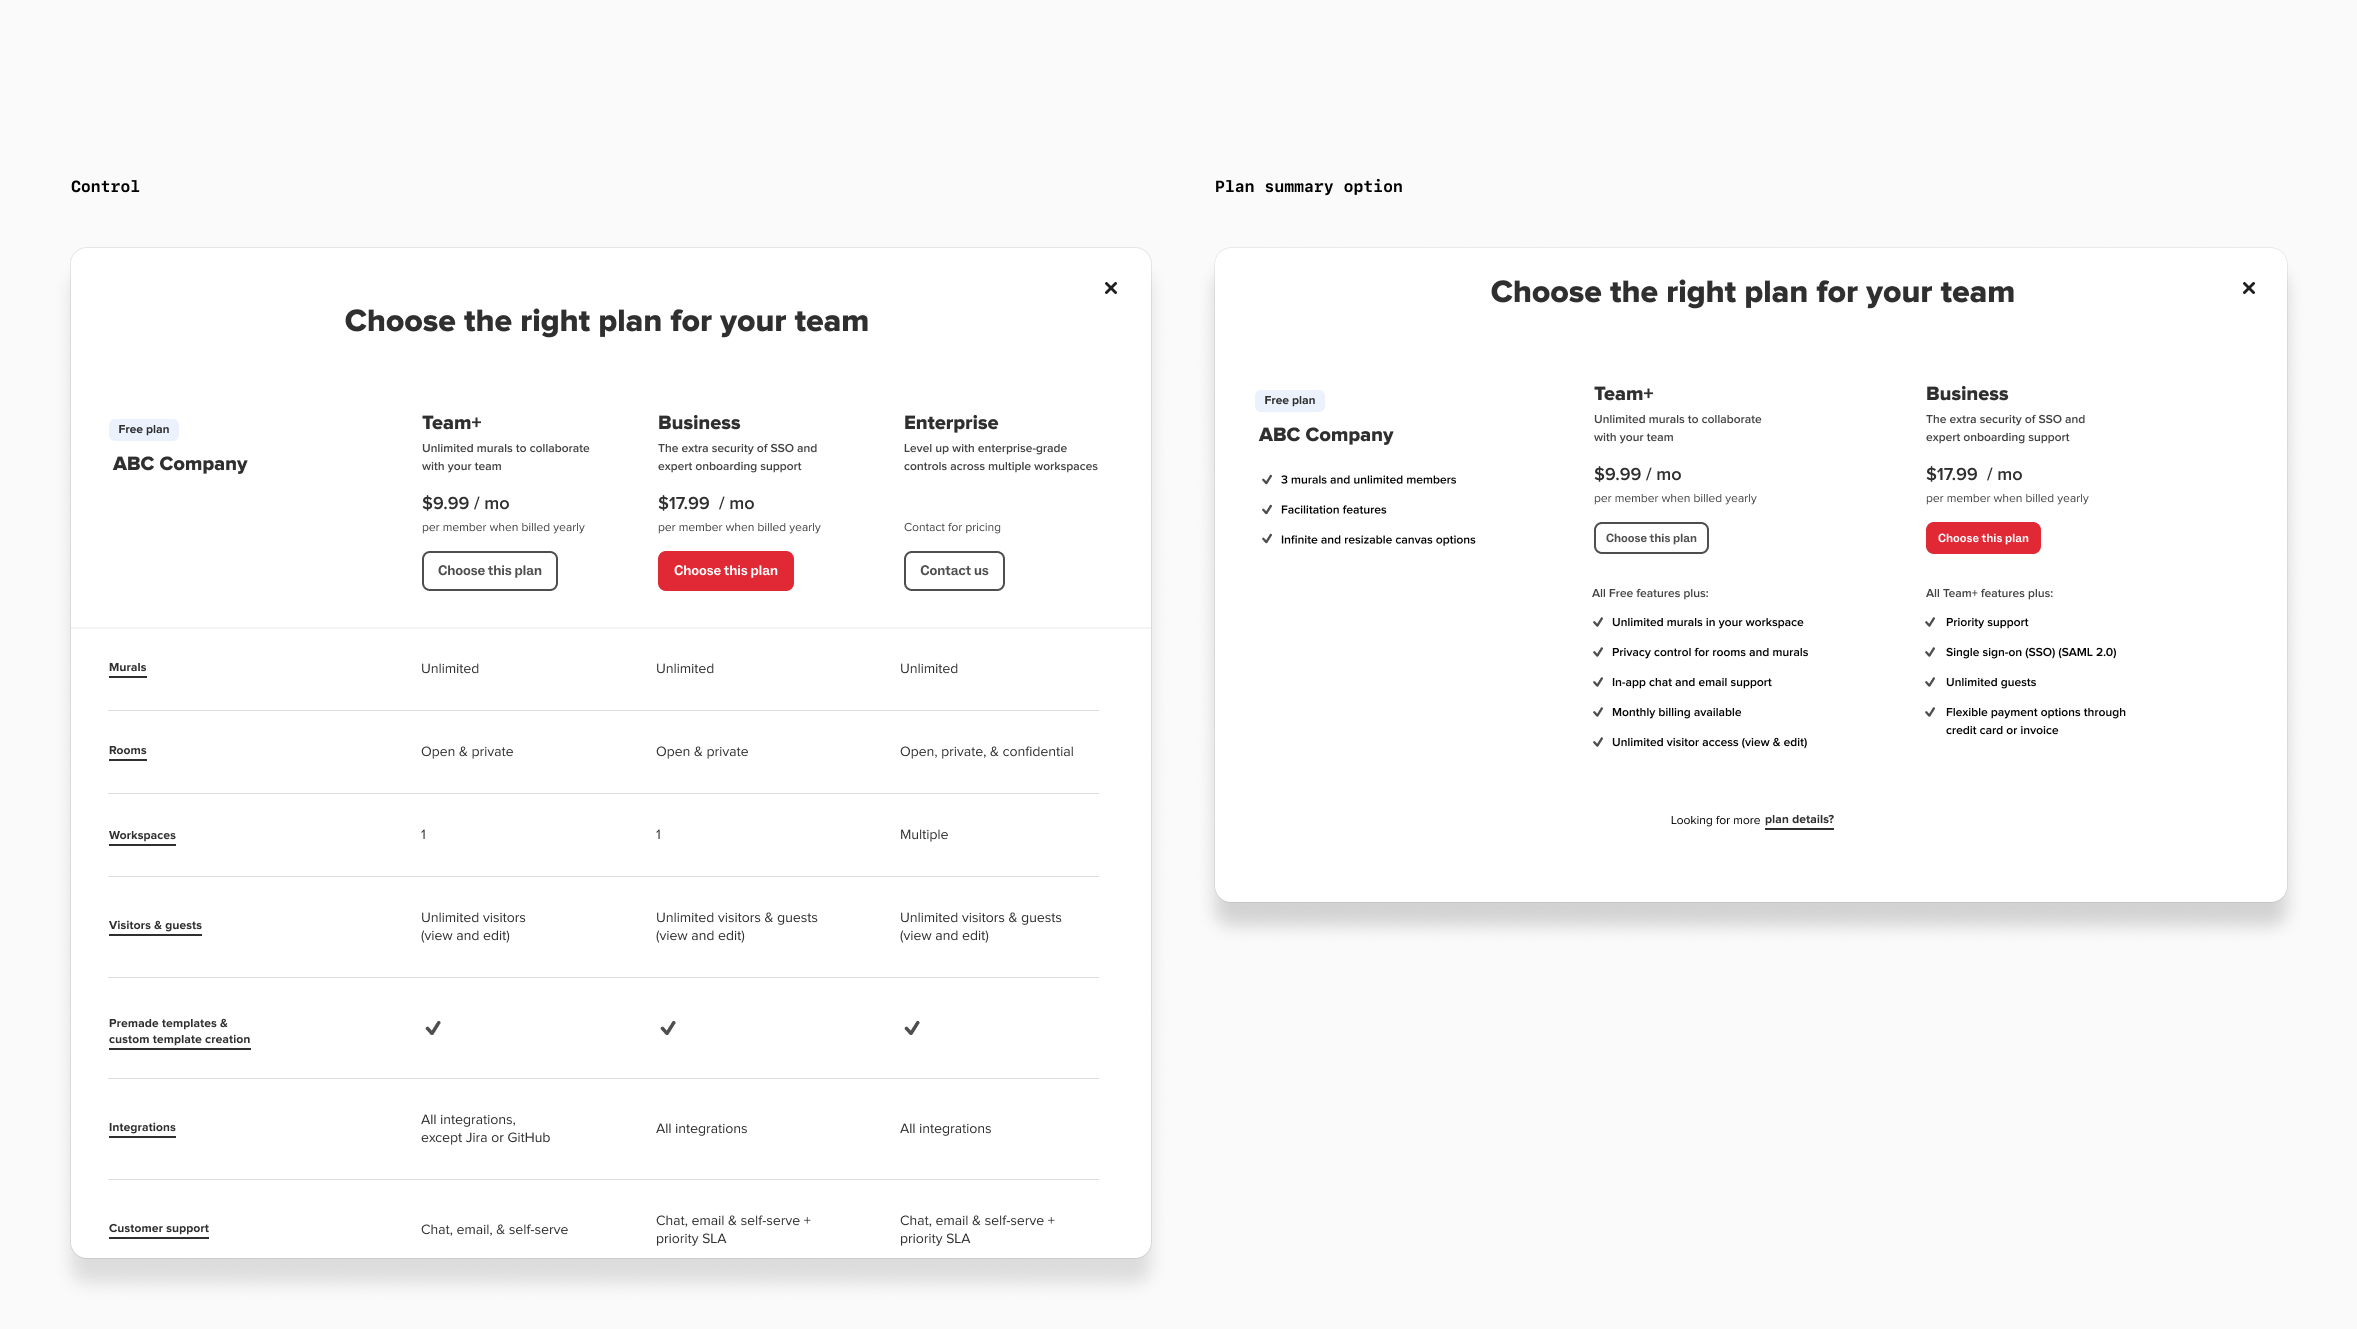
Results
After running the experiment for six weeks, the primary and secondary metrics were slightly higher in the test group but not statistically significant. We proceeded to production with the simplified summary version of the comparison page because there was no negative impact on ARR and key metrics. Additionally, we observed a 25% increase in Business plan selection and improved user experience with the summary in the product. Users also had the option to access the full list of features through a direct link to the marketing website.